Output files#
The output files generated are placed in a new subdirectory called output_files. This subdirectory will be located in the build directory the program runs from.
A set of three files will be created for each repetition of the simulation (also called run):
Coordinates file
Totals file
Local data file
The naming structure uses the set_label as the first number of the filename, and then denotes which run. For example, LocalData2run1.txt would be a local data file for a set labelled ‘2’ and for the first run of the simulation.
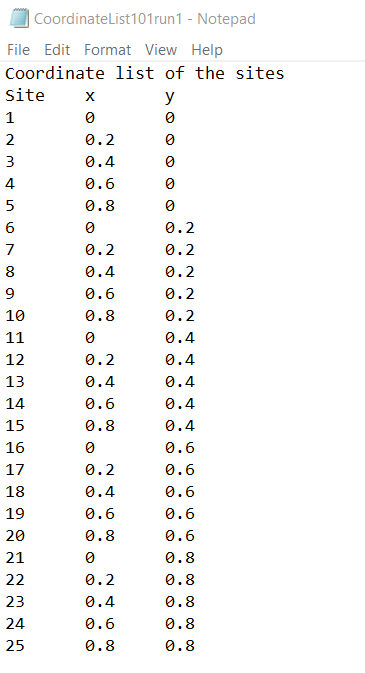
Coordinates output file#
The coordinates file records all the Patch (also called site) coordinates. These are 2D Cartesian coordinates.
The first column denotes the site index (a number purely assigned from the order the patches are created). The second and third columns contain the x and y coordinates respectively.
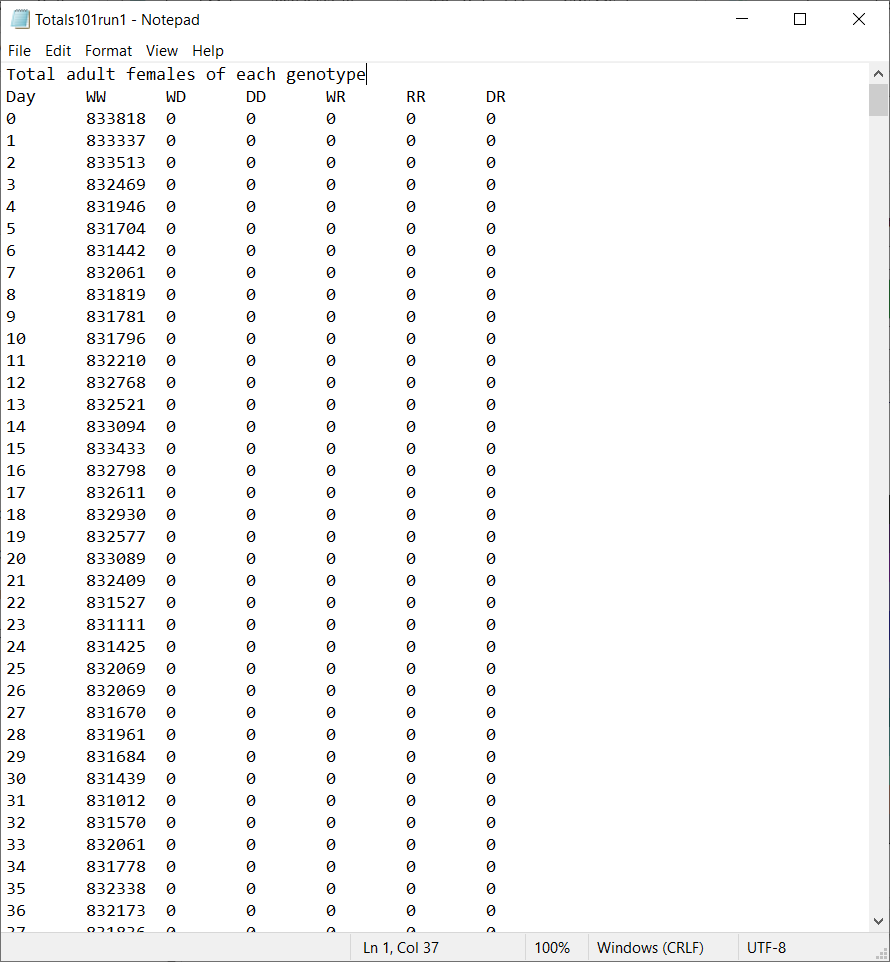
Totals file#
The totals file records the total number of adult mated female mosquitoes over all sites for each day of the simulation. These are divided into the different female genotypes available. By default, the program uses 6 genotypes (more information in the Default behaviours section).
The first column denotes the simulation day, where day 0 is the initialisation day. The following columns denote the number of females of each genotype, where W is a wild-type allele, D is a drive-type allele and R is a non-functional resistance allele.
Note
During the initialisation day, sites are populated with some initial populations and mosquitoes don’t carry out their life processes or disperse. This is to set a baseline for the model. Mosquito numbers are always recorded as the very last step of the simulation day.
Note
The model will simulate a burn-in period of 365 days before recording any data so that the modelled mosquito populations can reach an equilibrium before other modelled behaviours, such as gene drive release, are introduced. This is all done implicitly before recording starts.
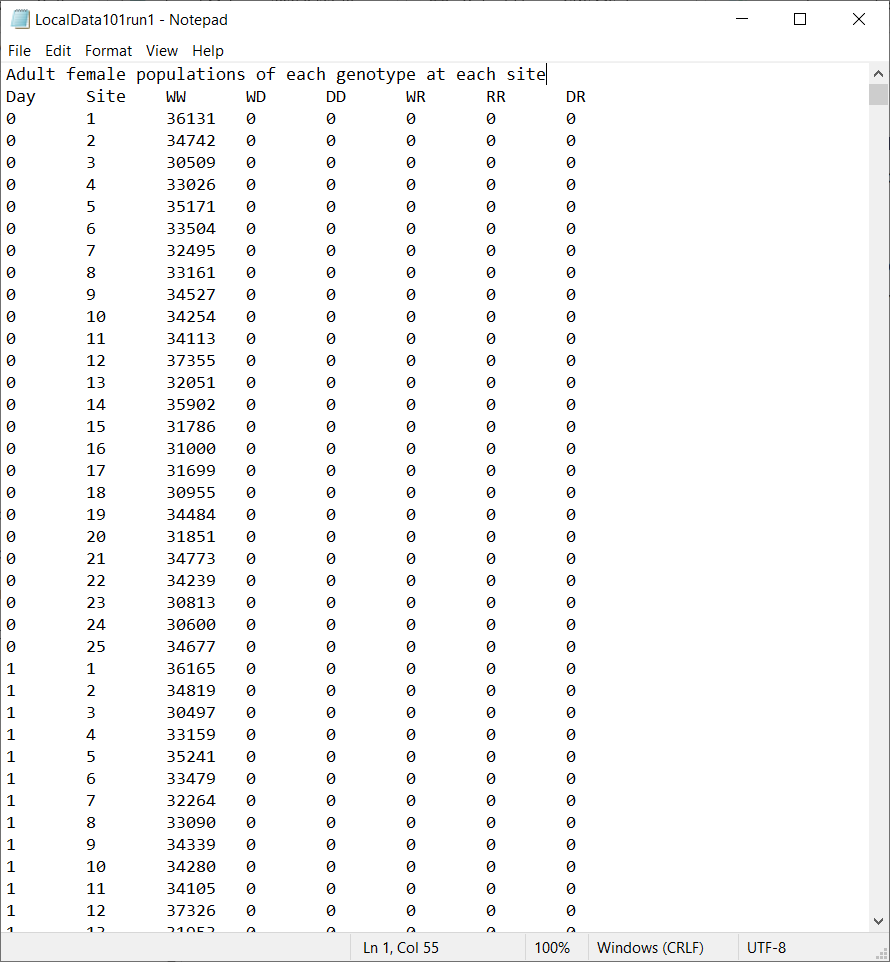
Local data file#
Similarly to the totals file, the local data file records the number of adult mated female mosquitoes for each day of the simulation, but this is split by each site. This provides a more in-depth view of the population evolution at each site. The female population numbers are also divided by genotype.
The first column again denotes the simulation day, the second column denotes the site index (as seen in Coordinates output file) and the following columns denote the number of females of each genotype (as seen in Totals file).